Bu fotoğraf hakkında
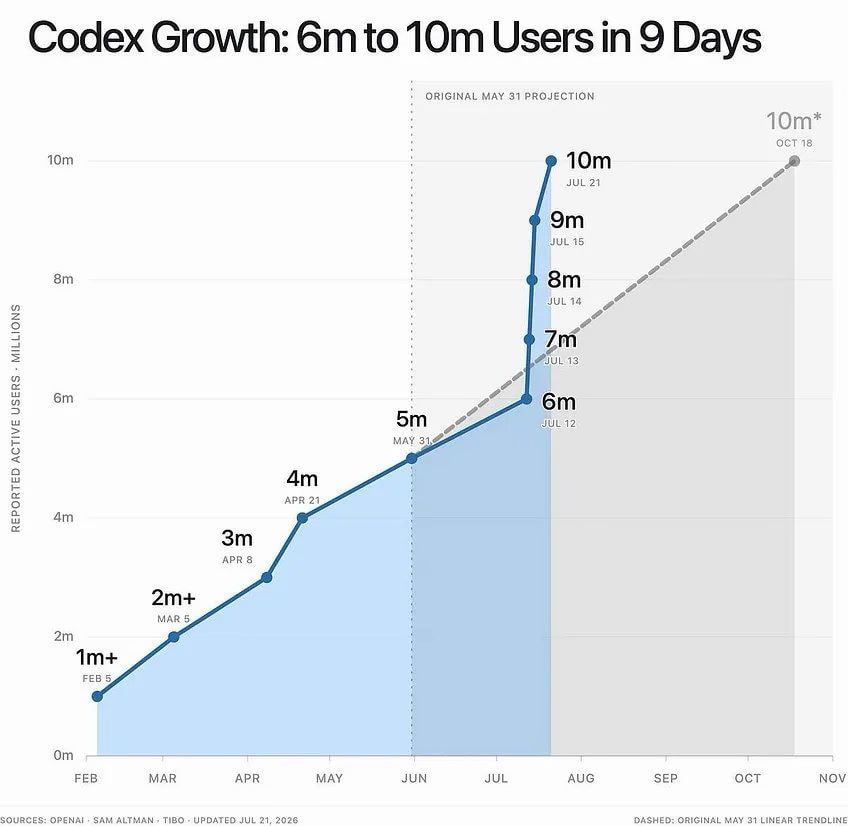
The image is a line graph showing user growth. The graph displays two lines, one solid blue and one dashed gray, charting reported active users in millions against months from February to November. The solid blue line shows a rapid increase from 1m+ in February to 10m in July, with specific data points labeled with user counts and dates. The dashed gray line represents an "ORIGINAL MAY 31 PROJECTION" showing a slower growth trend. The mood is informative and data-driven, with a clean, minimalist aesthetic. A notable detail is the steep, almost vertical climb of the blue line between July 12th and July 21st, indicating explosive growth. ON-SCREEN TEXT: Codex Growth: 6m to 10m Users in 9 Days ORIGINAL MAY 31 PROJECTION 10m* OCT 18 10m JUL 21 9m JUL 15 8m JUL 14 7m JUL 13 6m