Bu fotoğraf hakkında
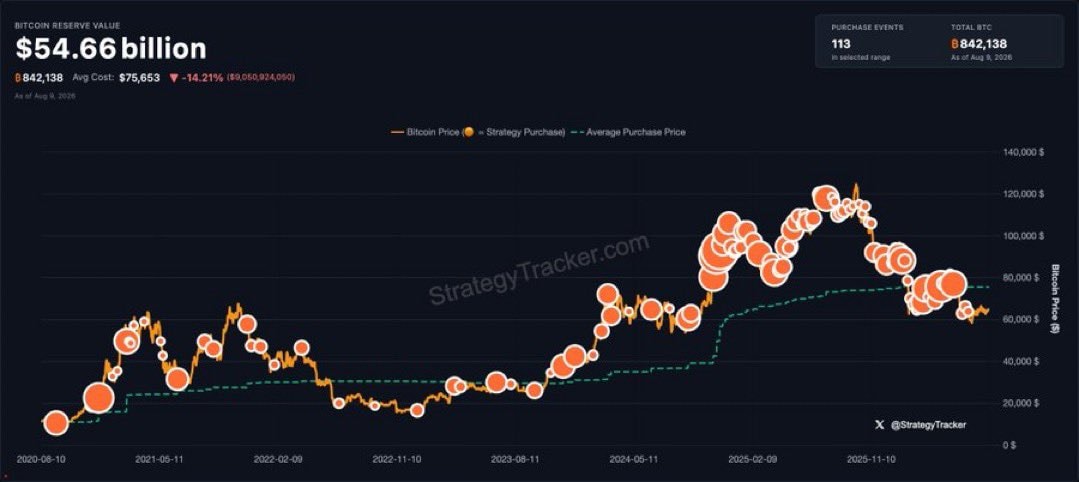
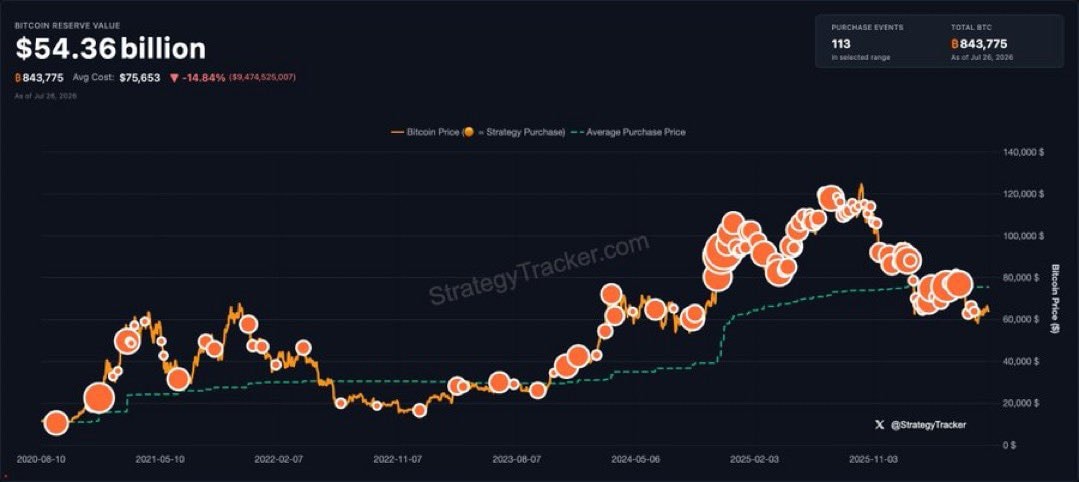
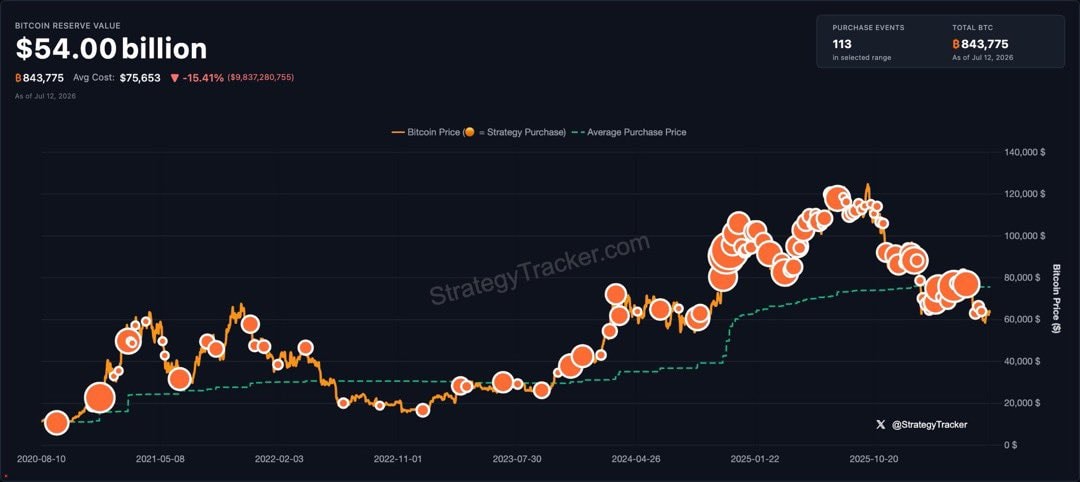
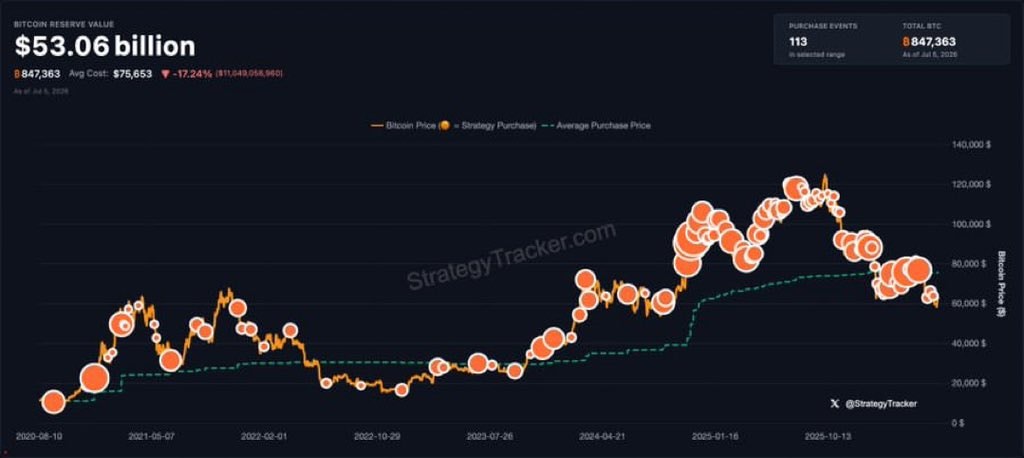
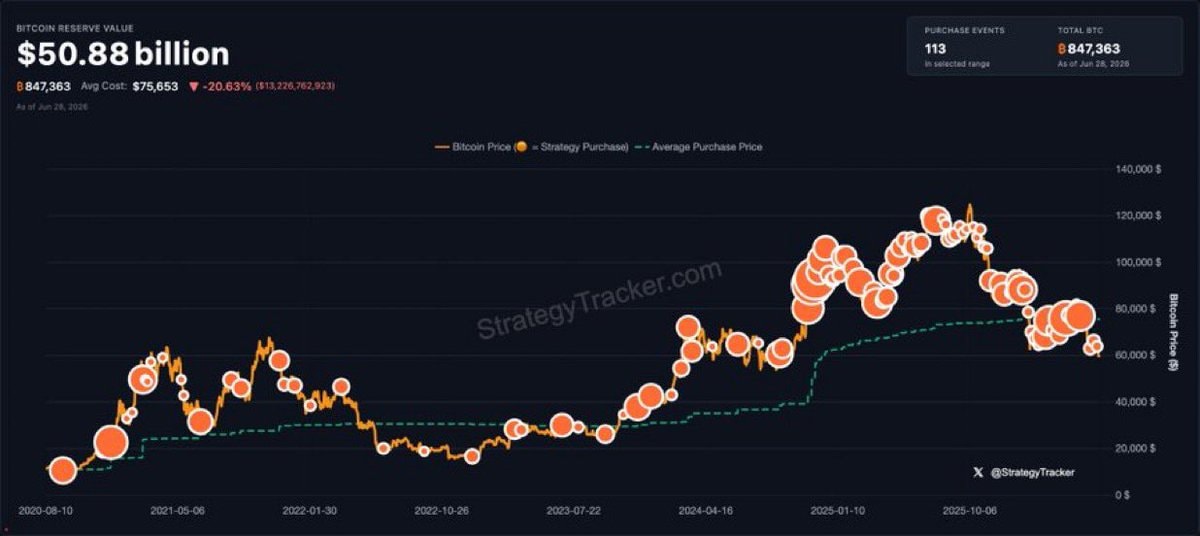
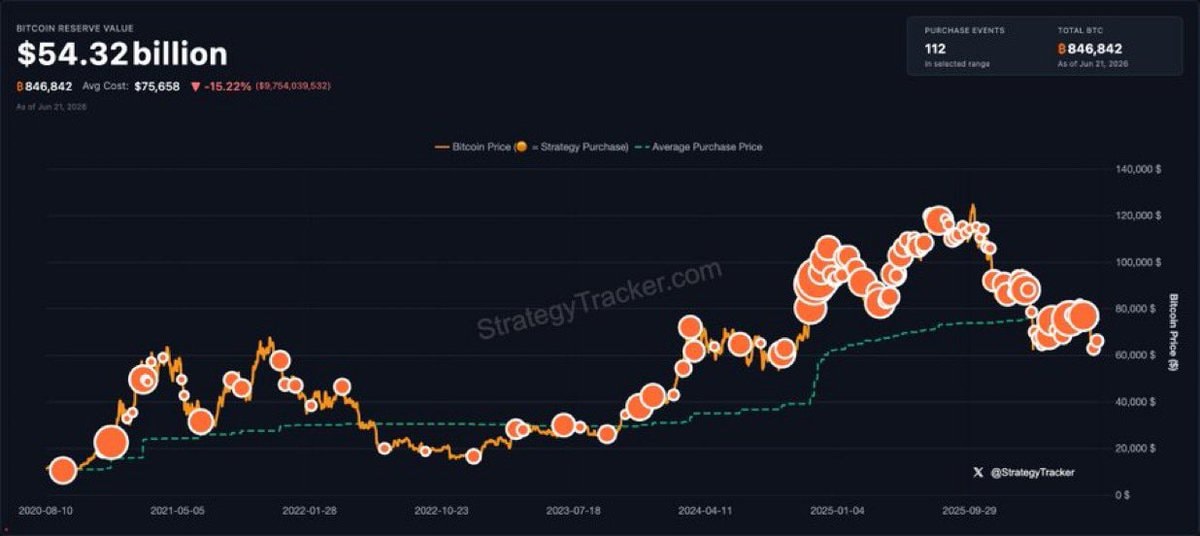
The image is a financial chart displaying Bitcoin's price history. The chart shows a fluctuating orange line representing Bitcoin's price, with larger orange circles indicating purchase events and a dashed green line showing the average purchase price. The overall mood is analytical and data-driven, typical of financial reporting. A prominent watermark reads "StrategyTracker.com" across the center of the chart, and a smaller watermark in the bottom right corner reads "X @StrategyTracker". The top left corner displays "BITCOIN RESERVE VALUE $54.66 billion" and "As of Aug 9, 2026".