
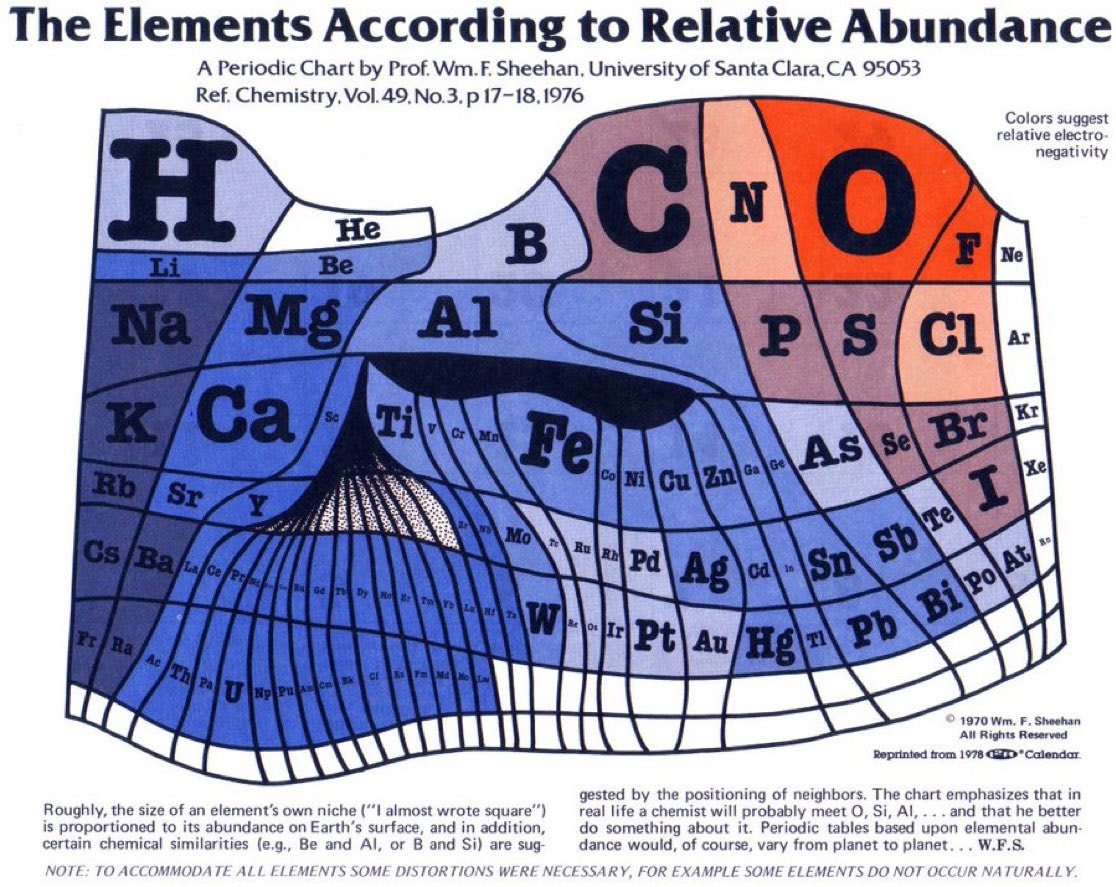
@sur_27The periodic table of elements scaled to show the actual abundance of the elements on Earth by Prof. Wm. F. Sheehan in 1976. #Science
Orijinal gönderiyi gör@sur_27The periodic table of elements scaled to show the actual abundance of the elements on Earth by Prof. Wm. F. Sheehan in 1976. #Science
Orijinal gönderiyi gör@sur_27 tarafından fotoğraf· Aug 31, 2026· Science
The image is a diagram of the elements according to relative abundance. It's a stylized periodic table with elements represented by their symbols within irregularly shaped cells. The cells are colored in shades of blue, orange, and brown, with a note that colors suggest relative electronegativity. A notable visual element is a 3D-like representation of a landscape or structure in the lower-middle section of the chart, connecting various elements. The style is educational and infographic-like. ON-SCREEN TEXT: The Elements According to Relative Abundance A Periodic Chart by Prof. Wm. F. Sheehan, University of Santa Clara, CA 95053 Ref. Chemistry, Vol.49, No.3, p 17-18, 1976 Colors suggest relative electronegativity © 1970 Wm. F. Sheehan All Rights Reserved Reprinted from 1978 G&D Calendar. Roughly, the size of an element's own niche ("I almost wrote square") is proportioned
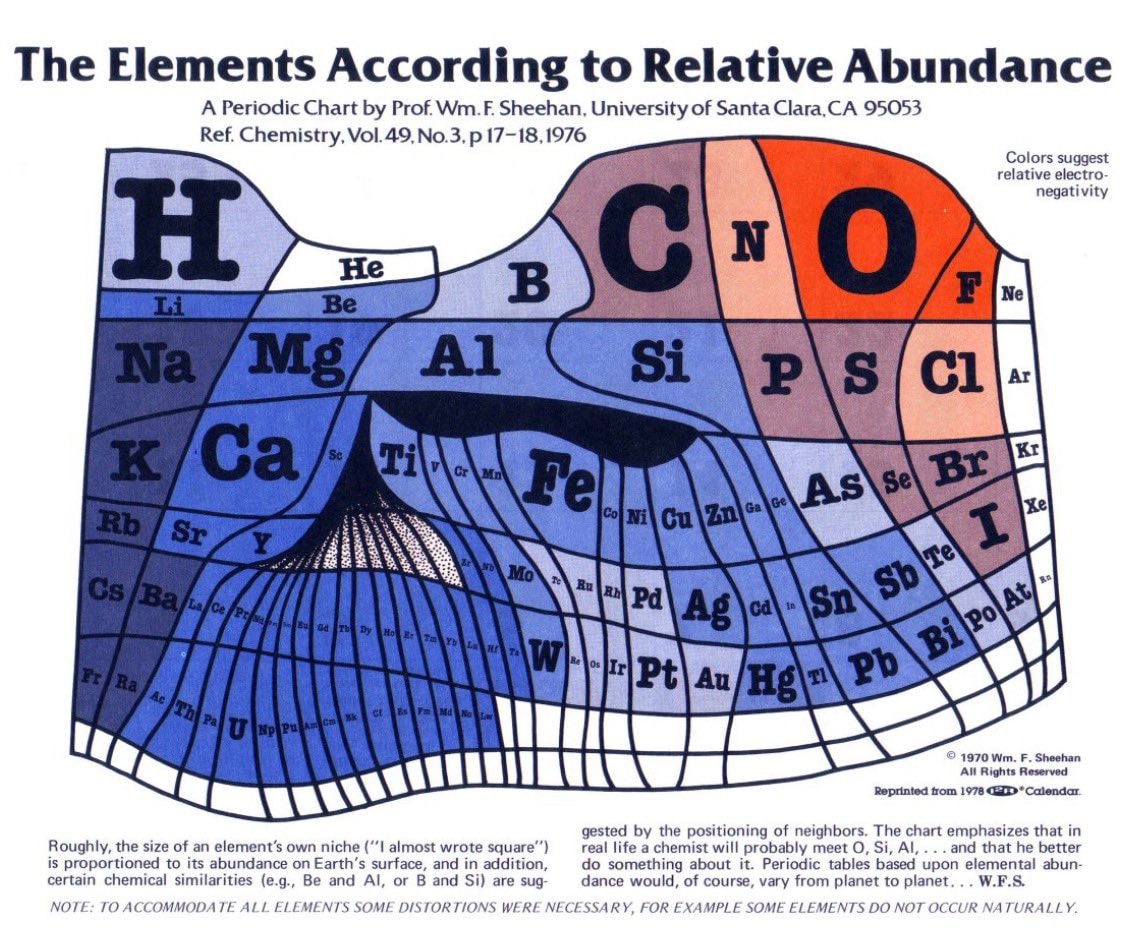 Sheehan Periodic Table Abundance
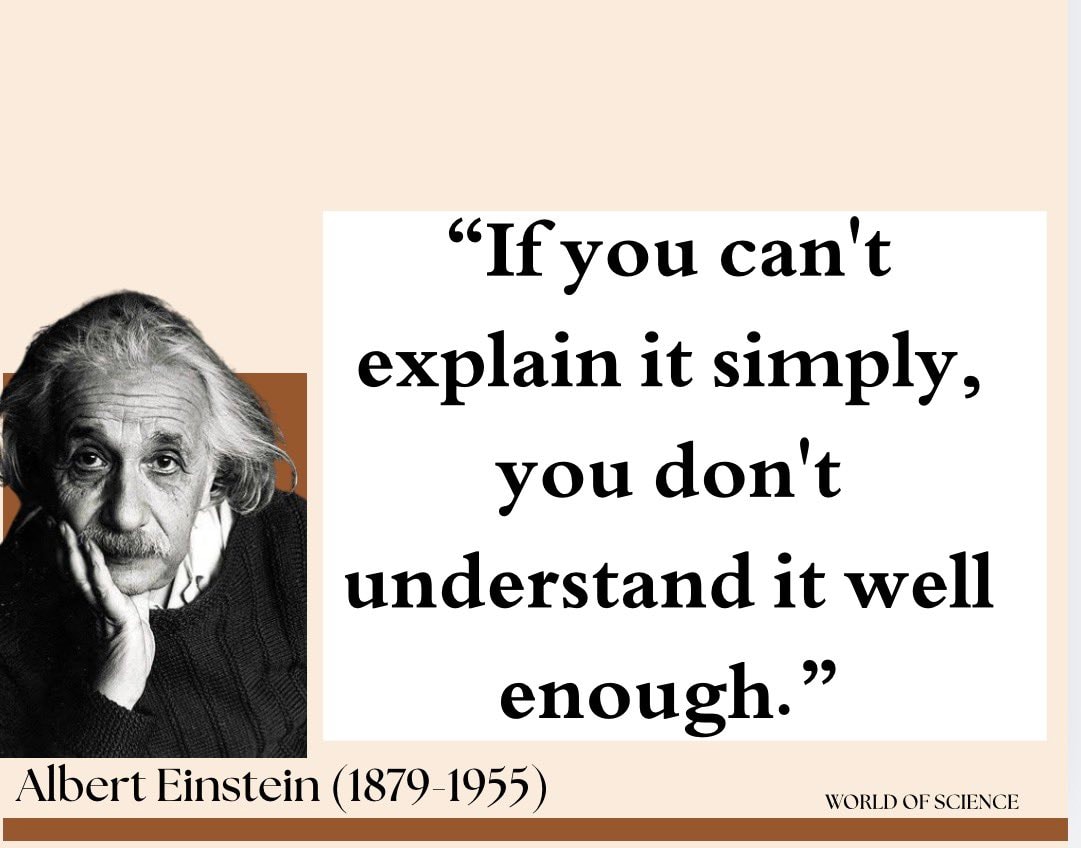 Albert Einstein quote WORLD OF SCIENCE
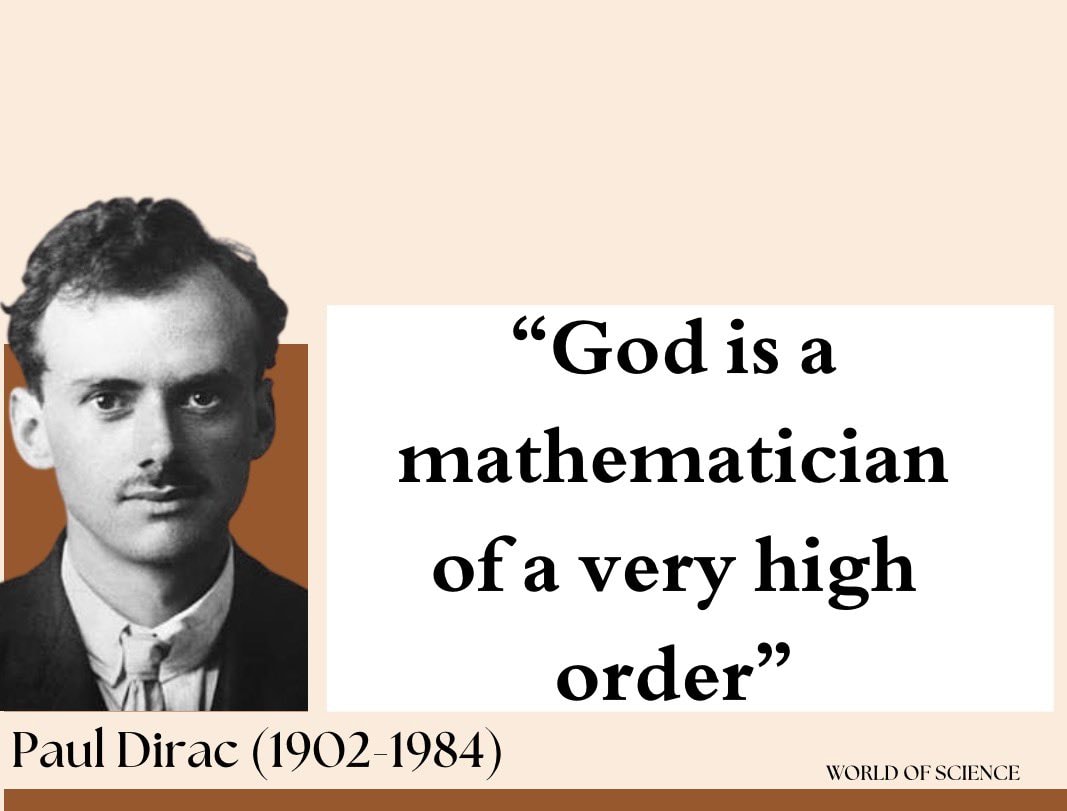 Paul Dirac quote
 Terence Tao on his weaknesses
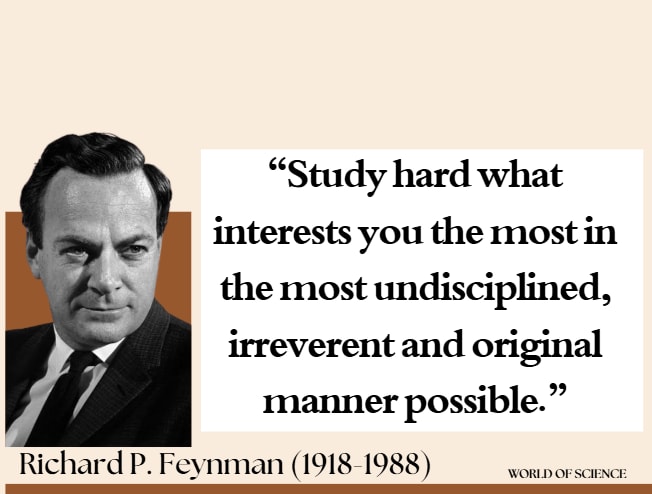 Richard P. Feynman quote
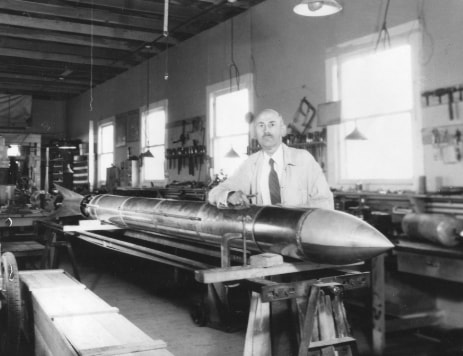 Robert H. Goddard rocket workshop
 Walter Lewin on physics classes
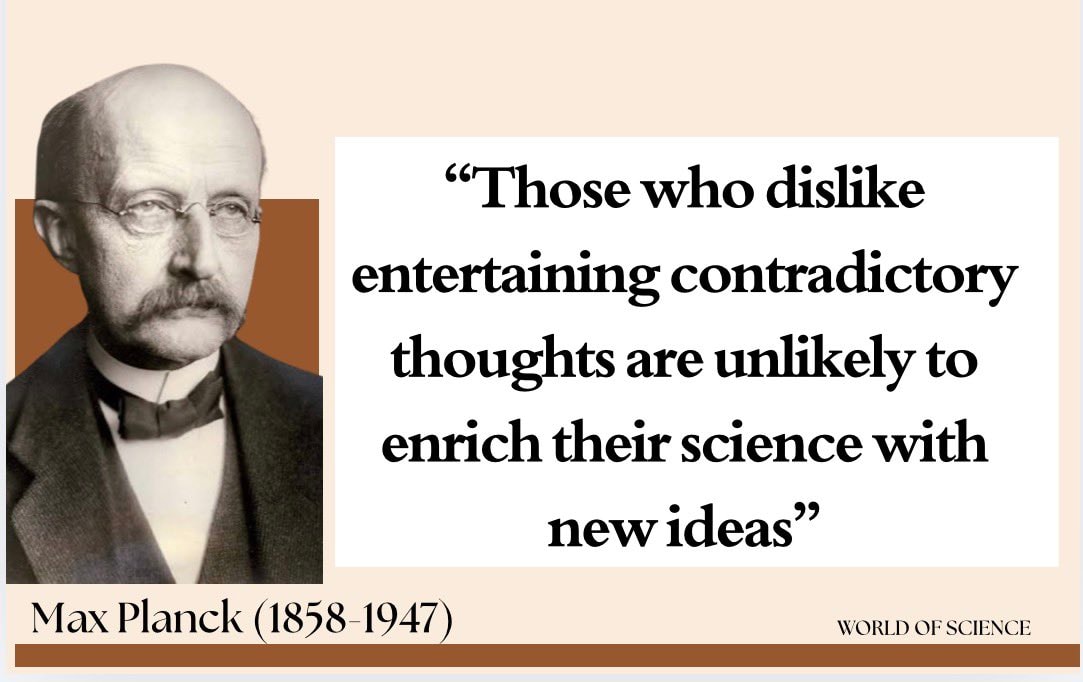 Max Planck portrait
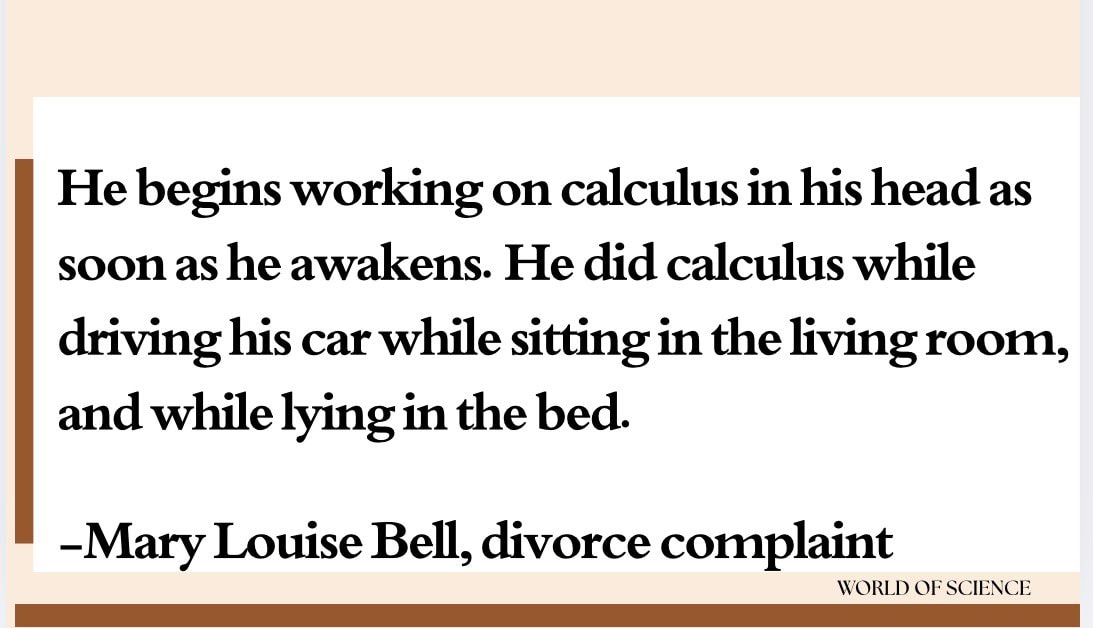 Feynman divorce complaint Calculus
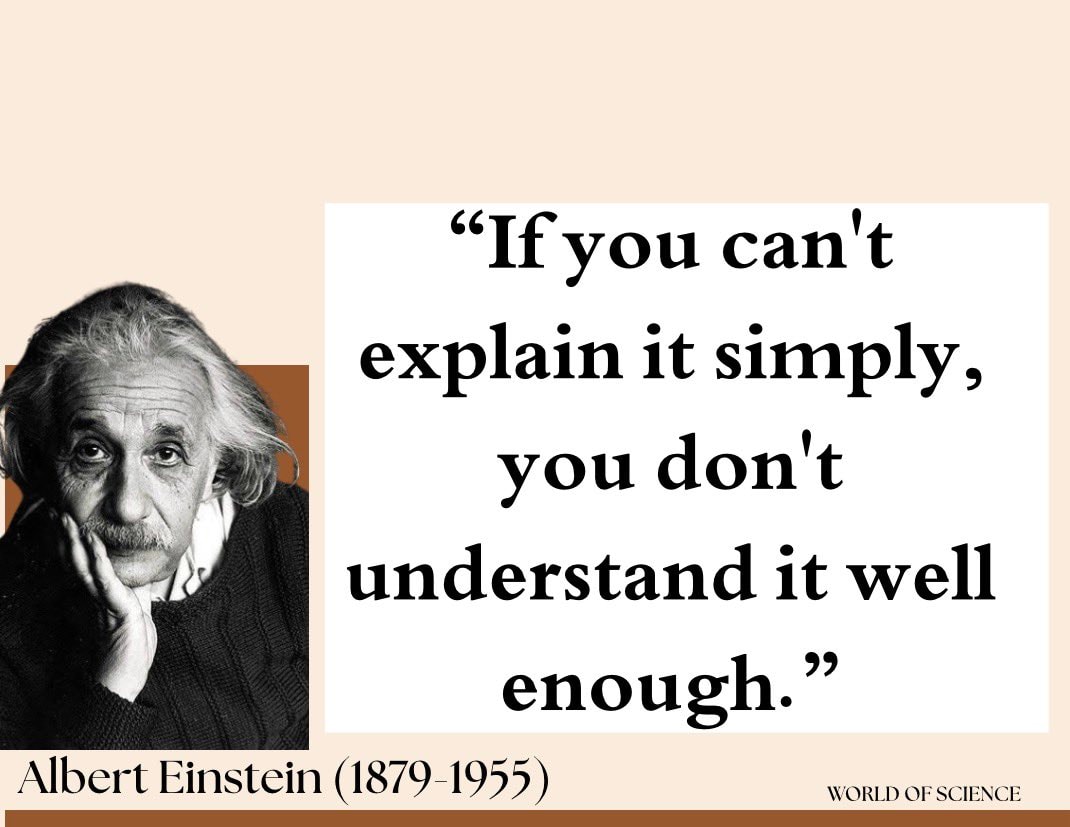 Albert Einstein quote
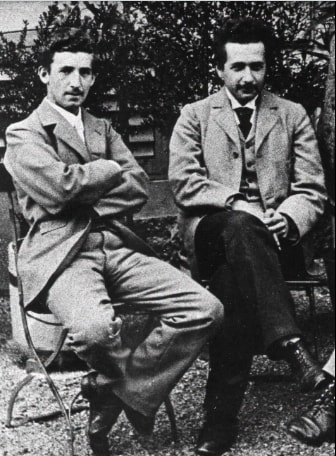 Albert Einstein and Marcel Grossmann portrait
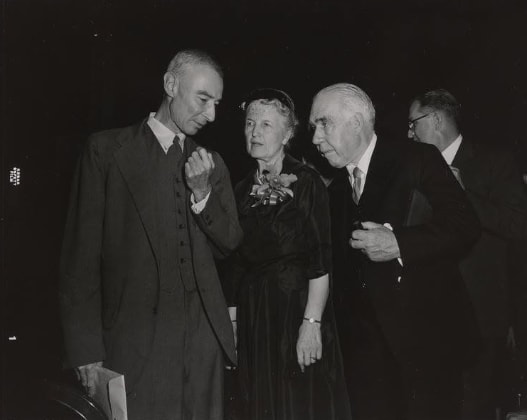 Niels Bohr first Atoms for Peace Award
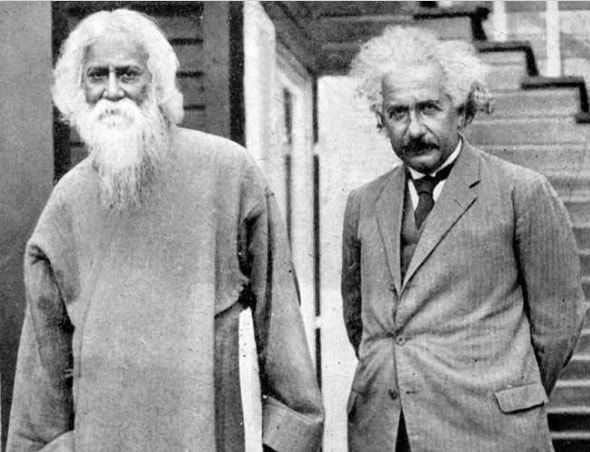 Einstein with Rabindranath Tagore 1930
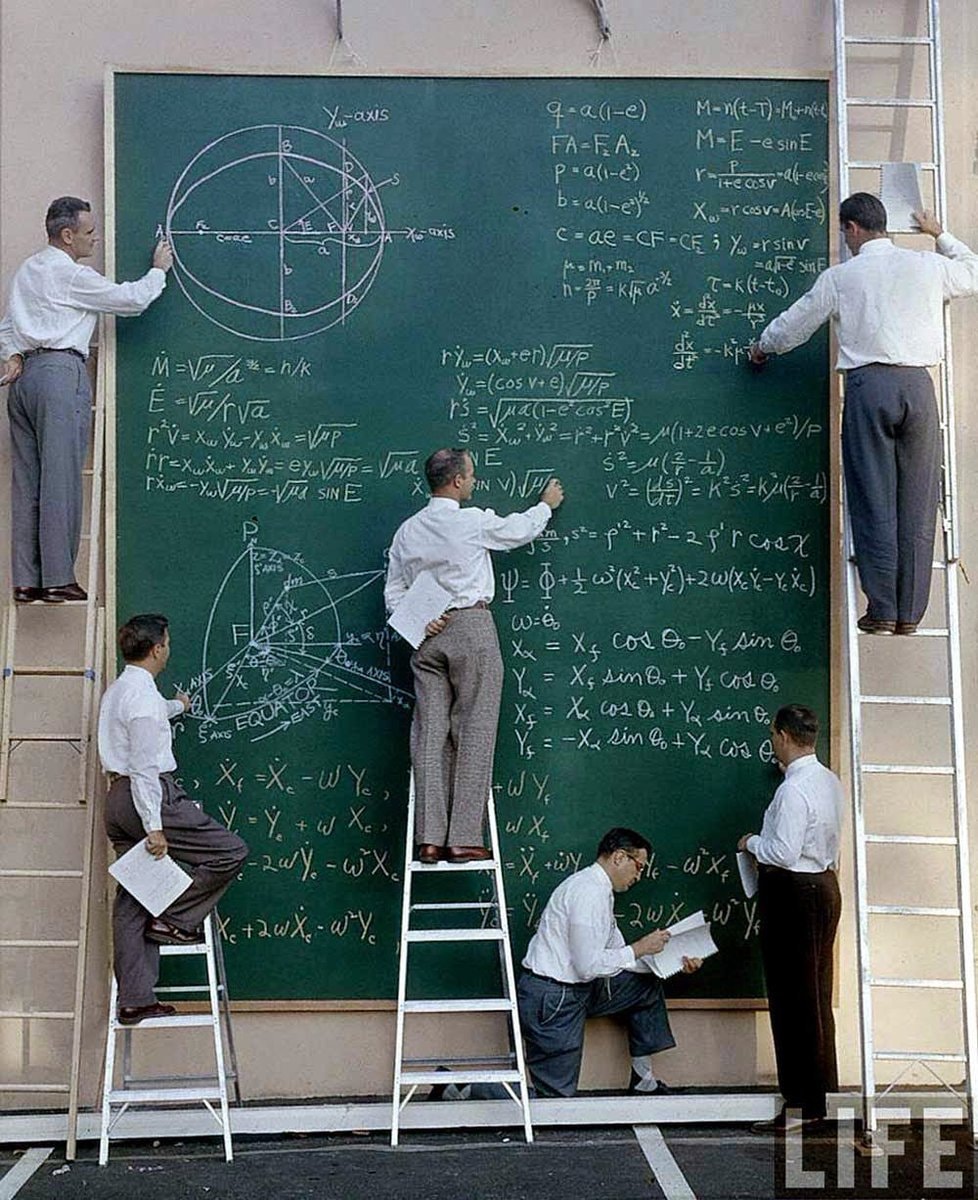 2NASA researchers 1957
 Ectopic pregnancy 9-week fetus
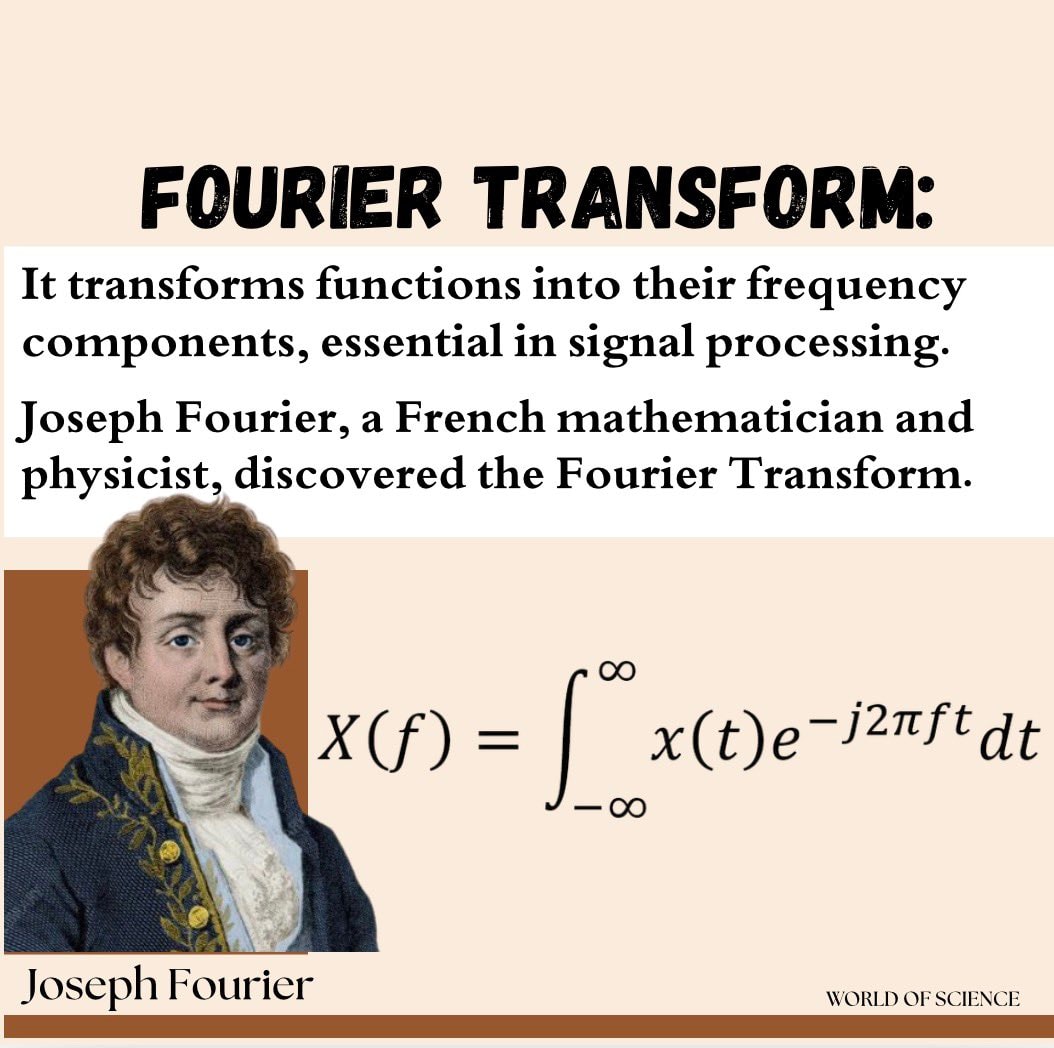 Joseph Fourier and the Fourier Transform
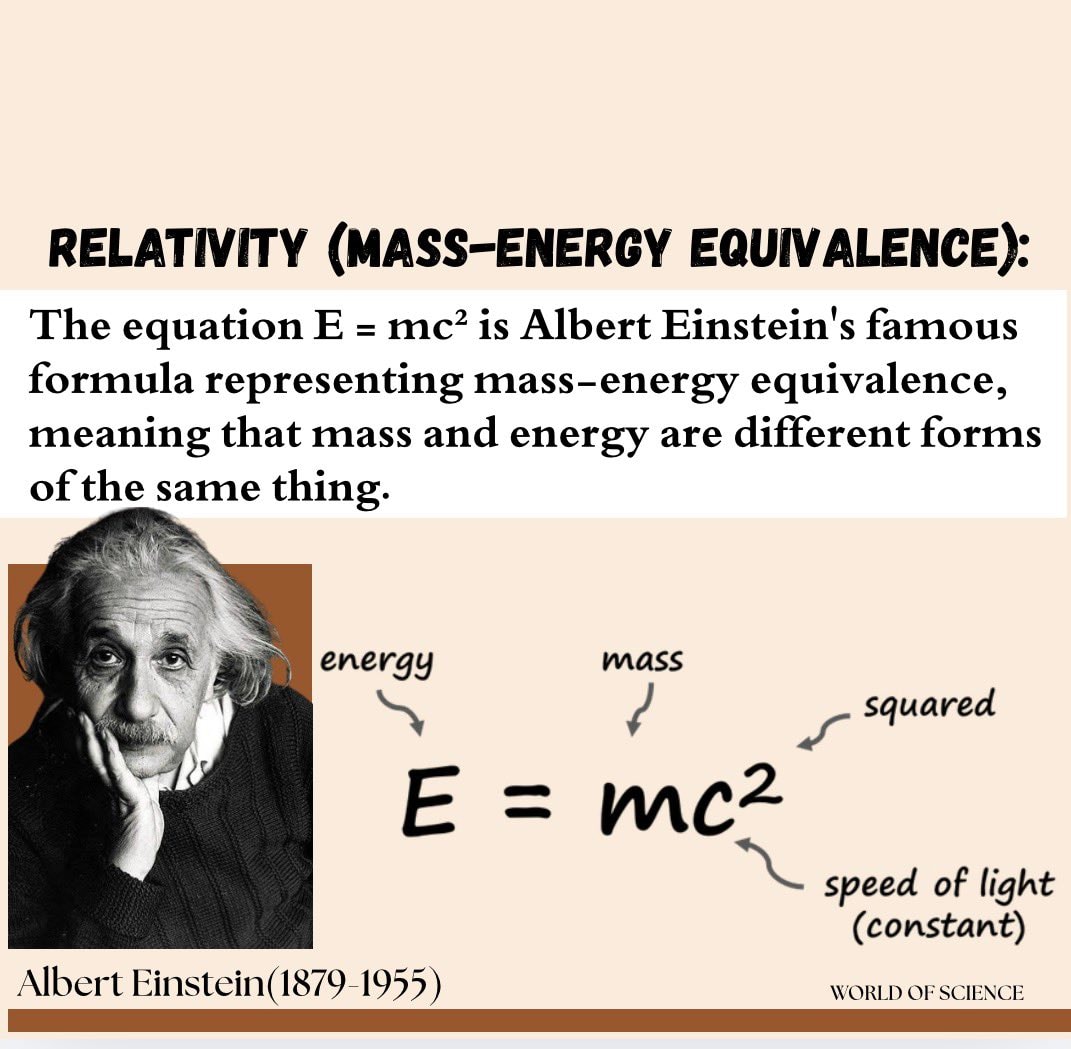 Albert Einstein E=mc²
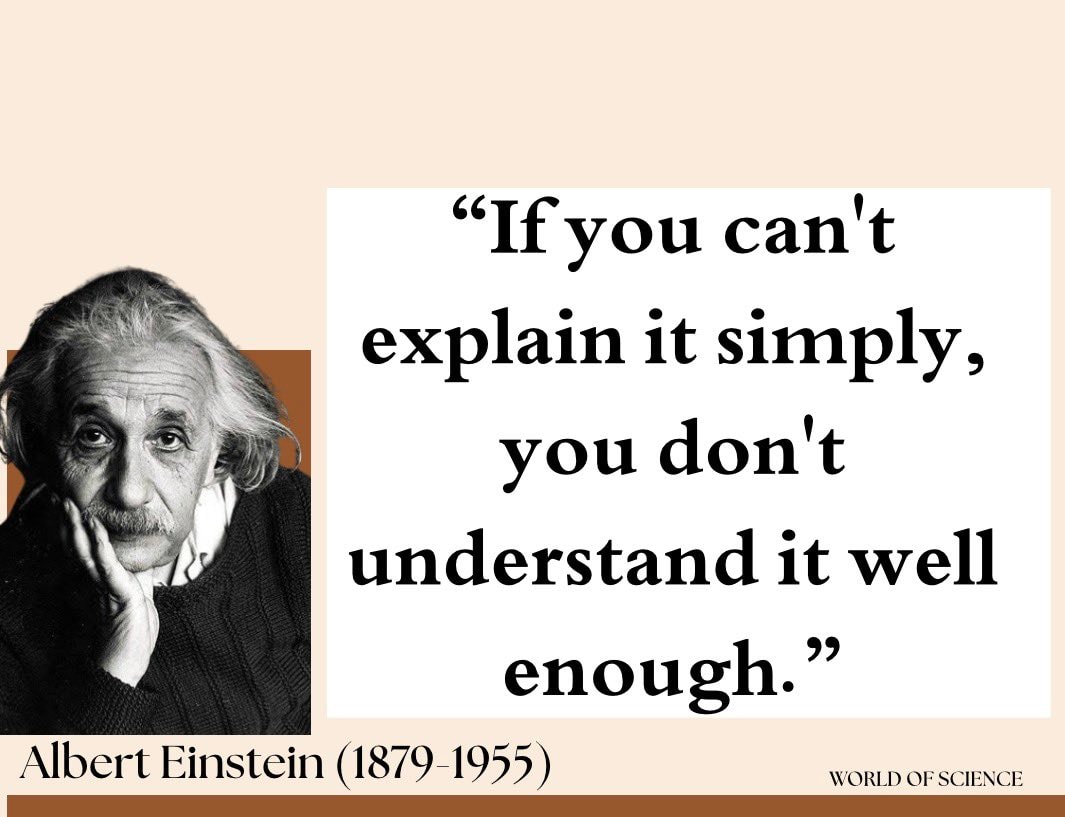 Albert Einstein portrait
@sur_27The periodic table of elements scaled to show the actual abundance of the elements on Earth by Prof. Wm. F. Sheehan in 1976. #Science
Orijinal gönderiyi gör@sur_27 tarafından fotoğraf· Aug 31, 2026· Science
The image is a diagram of the elements according to relative abundance. It's a stylized periodic table with elements represented by their symbols within irregularly shaped cells. The cells are colored in shades of blue, orange, and brown, with a note that colors suggest relative electronegativity. A notable visual element is a 3D-like representation of a landscape or structure in the lower-middle section of the chart, connecting various elements. The style is educational and infographic-like. ON-SCREEN TEXT: The Elements According to Relative Abundance A Periodic Chart by Prof. Wm. F. Sheehan, University of Santa Clara, CA 95053 Ref. Chemistry, Vol.49, No.3, p 17-18, 1976 Colors suggest relative electronegativity © 1970 Wm. F. Sheehan All Rights Reserved Reprinted from 1978 G&D Calendar. Roughly, the size of an element's own niche ("I almost wrote square") is proportioned
Henüz yorum yok. İlk yorumu sen yap!
Sheehan Periodic Table AbundanceAlbert Einstein quote WORLD OF SCIENCEPaul Dirac quoteTerence Tao on his weaknessesRichard P. Feynman quoteRobert H. Goddard rocket workshopWalter Lewin on physics classesMax Planck portraitFeynman divorce complaint CalculusAlbert Einstein quoteAlbert Einstein and Marcel Grossmann portraitNiels Bohr first Atoms for Peace AwardEinstein with Rabindranath Tagore 19302NASA researchers 1957Ectopic pregnancy 9-week fetusJoseph Fourier and the Fourier TransformAlbert Einstein E=mc²Albert Einstein portrait
Henüz yorum yok. İlk yorumu sen yap!