
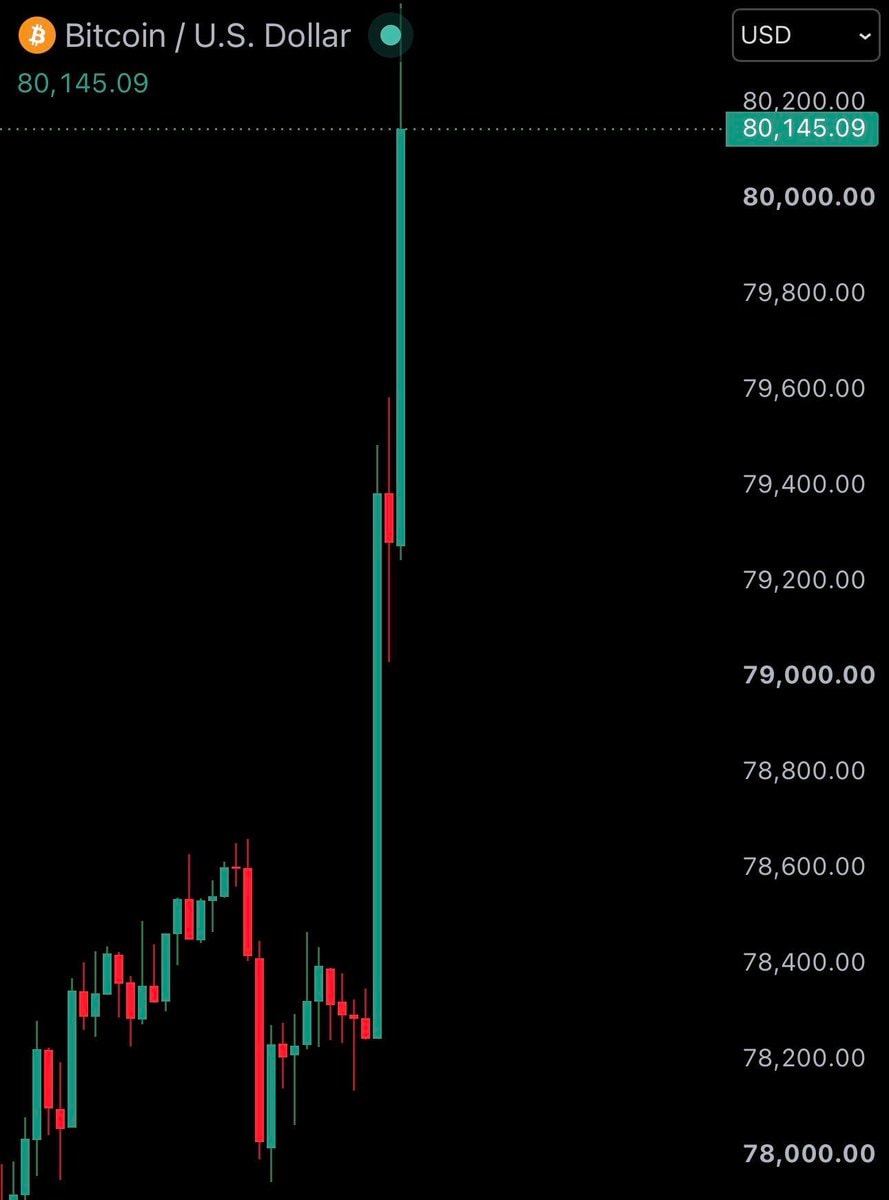
@Jakob.erasBitcoin hit $80,000 and $320,000,000 in short positions got liquidated from the crypto market within a 30-minute window
Orijinal gönderiyi gör@Jakob.erasBitcoin hit $80,000 and $320,000,000 in short positions got liquidated from the crypto market within a 30-minute window
Orijinal gönderiyi gör@Jakob.eras tarafından fotoğraf· Nov 4, 2026· Bitcoin
The image is a dark-themed candlestick chart of Bitcoin priced against the U.S. Dollar. A massive green vertical wick shoots upward from around 79,400 to a high of 80,200 before closing near 80,145.09, towering over a series of smaller green and red candles that form a jagged uptrend in the lower-left portion of the frame. The current price of 80,145.09 is displayed in green at the top left and again in a highlighted box on the right price ladder. The overall aesthetic is a clean, high-contrast financial trading interface with a black background and teal, red, and white elements. On-screen text reads exactly: “Bitcoin / U.S. Dollar”, “80,145.09”, and “USD”.
 Bitcoin falls under $62,000
 2Bitcoin price dip
 3Citi Bitcoin and Ethereum price targets
 2Michael Saylor on banks and Bitcoin
 Bitcoin price movement chart
 Crypto market cap losses heatmap
 2Bitcoin and ETH price drop
 Bitcoin BTC crash under $66,000
 4Bitcoin U.S. Dollar crash
 Bitcoin crash $67,000
 Crypto market crash $BTC $ETH $XRP $SOL
 2Bitcoin ETH price crash
 Bitcoin falls under $70,000
 Bitcoin falls under $71,000
 2Bitcoin under $72,000
 Roundtable on Bitcoin, inflation and Intuition
 4Crypto market drop: SOL, XRP, ETH, BTC
 Bitcoin price drop
@Jakob.erasBitcoin hit $80,000 and $320,000,000 in short positions got liquidated from the crypto market within a 30-minute window
Orijinal gönderiyi gör@Jakob.eras tarafından fotoğraf· Nov 4, 2026· Bitcoin
The image is a dark-themed candlestick chart of Bitcoin priced against the U.S. Dollar. A massive green vertical wick shoots upward from around 79,400 to a high of 80,200 before closing near 80,145.09, towering over a series of smaller green and red candles that form a jagged uptrend in the lower-left portion of the frame. The current price of 80,145.09 is displayed in green at the top left and again in a highlighted box on the right price ladder. The overall aesthetic is a clean, high-contrast financial trading interface with a black background and teal, red, and white elements. On-screen text reads exactly: “Bitcoin / U.S. Dollar”, “80,145.09”, and “USD”.
Bitcoin falls under $62,0002Bitcoin price dip3Citi Bitcoin and Ethereum price targets2Michael Saylor on banks and BitcoinBitcoin price movement chartCrypto market cap losses heatmap2Bitcoin and ETH price dropBitcoin BTC crash under $66,0004Bitcoin U.S. Dollar crashBitcoin crash $67,000Crypto market crash $BTC $ETH $XRP $SOL2Bitcoin ETH price crashBitcoin falls under $70,000Bitcoin falls under $71,0002Bitcoin under $72,000Roundtable on Bitcoin, inflation and Intuition4Crypto market drop: SOL, XRP, ETH, BTCBitcoin price drop